In last week’s Numbers Game, I compared teams on their Shots on Goal (SOG) and Goals For statistics. The analysis revealed that teams ranked in the top 10 in SOG were far more likely to be among the top 10 teams in Goals For. However, teams that ranked between 11th-20th in the league in SOG tended to be among the league’s lowest in Goals For while the lowest ranked teams in SOG were generally in the middle of the pack in Goals For.
Today’s Numbers Game looks at the defensive side of the shots/goals analysis: Do teams that give up more shots against give up more goals? It would certainly seem like a logical inference and we have already seen that more shots mean more goals on the offensive side of the game. However, the numbers tell a different story.
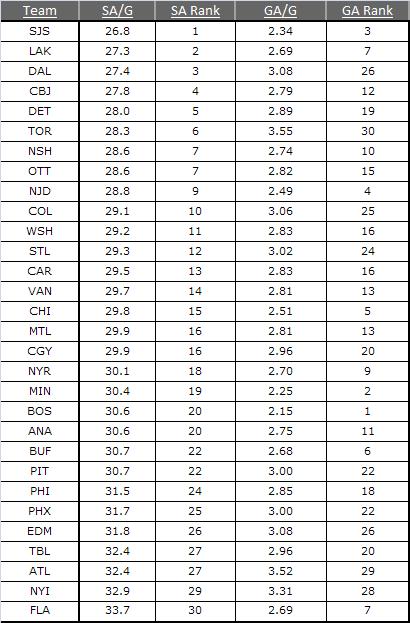
Out of the top 10 teams in shots against/game (SA/g), only 3 have a team goals against/game (GA/g) in the top 10 in the league. In fact, the Leafs, who have a league-worst 3.55 GA/g, and the Stars, who have the 5th worse GA/g in the league, are ranked 6th and 3rd, respectively, in SA/g. On the other side of the spectrum, the Panthers allow a league-worst 33.7 SA/g, but they rank 7th in GA/g.
Not surprisingly, the Bruins, riding the awkward goaltending style of Tim Thomas to win after win, have the best GA/g in the league. However, they are giving up more than 30 shots against every game and are ranked 20th in that department. The Wild, with the 2nd best GA/g, sit 19th.
As the numbers suggest, there is only a small correlation between shots against and goals against. While teams focus on shot prevention, their success, at least for this season, ultimately seem to lie in the hands of their goaltenders.